Forest stand analysis based on remote sensing
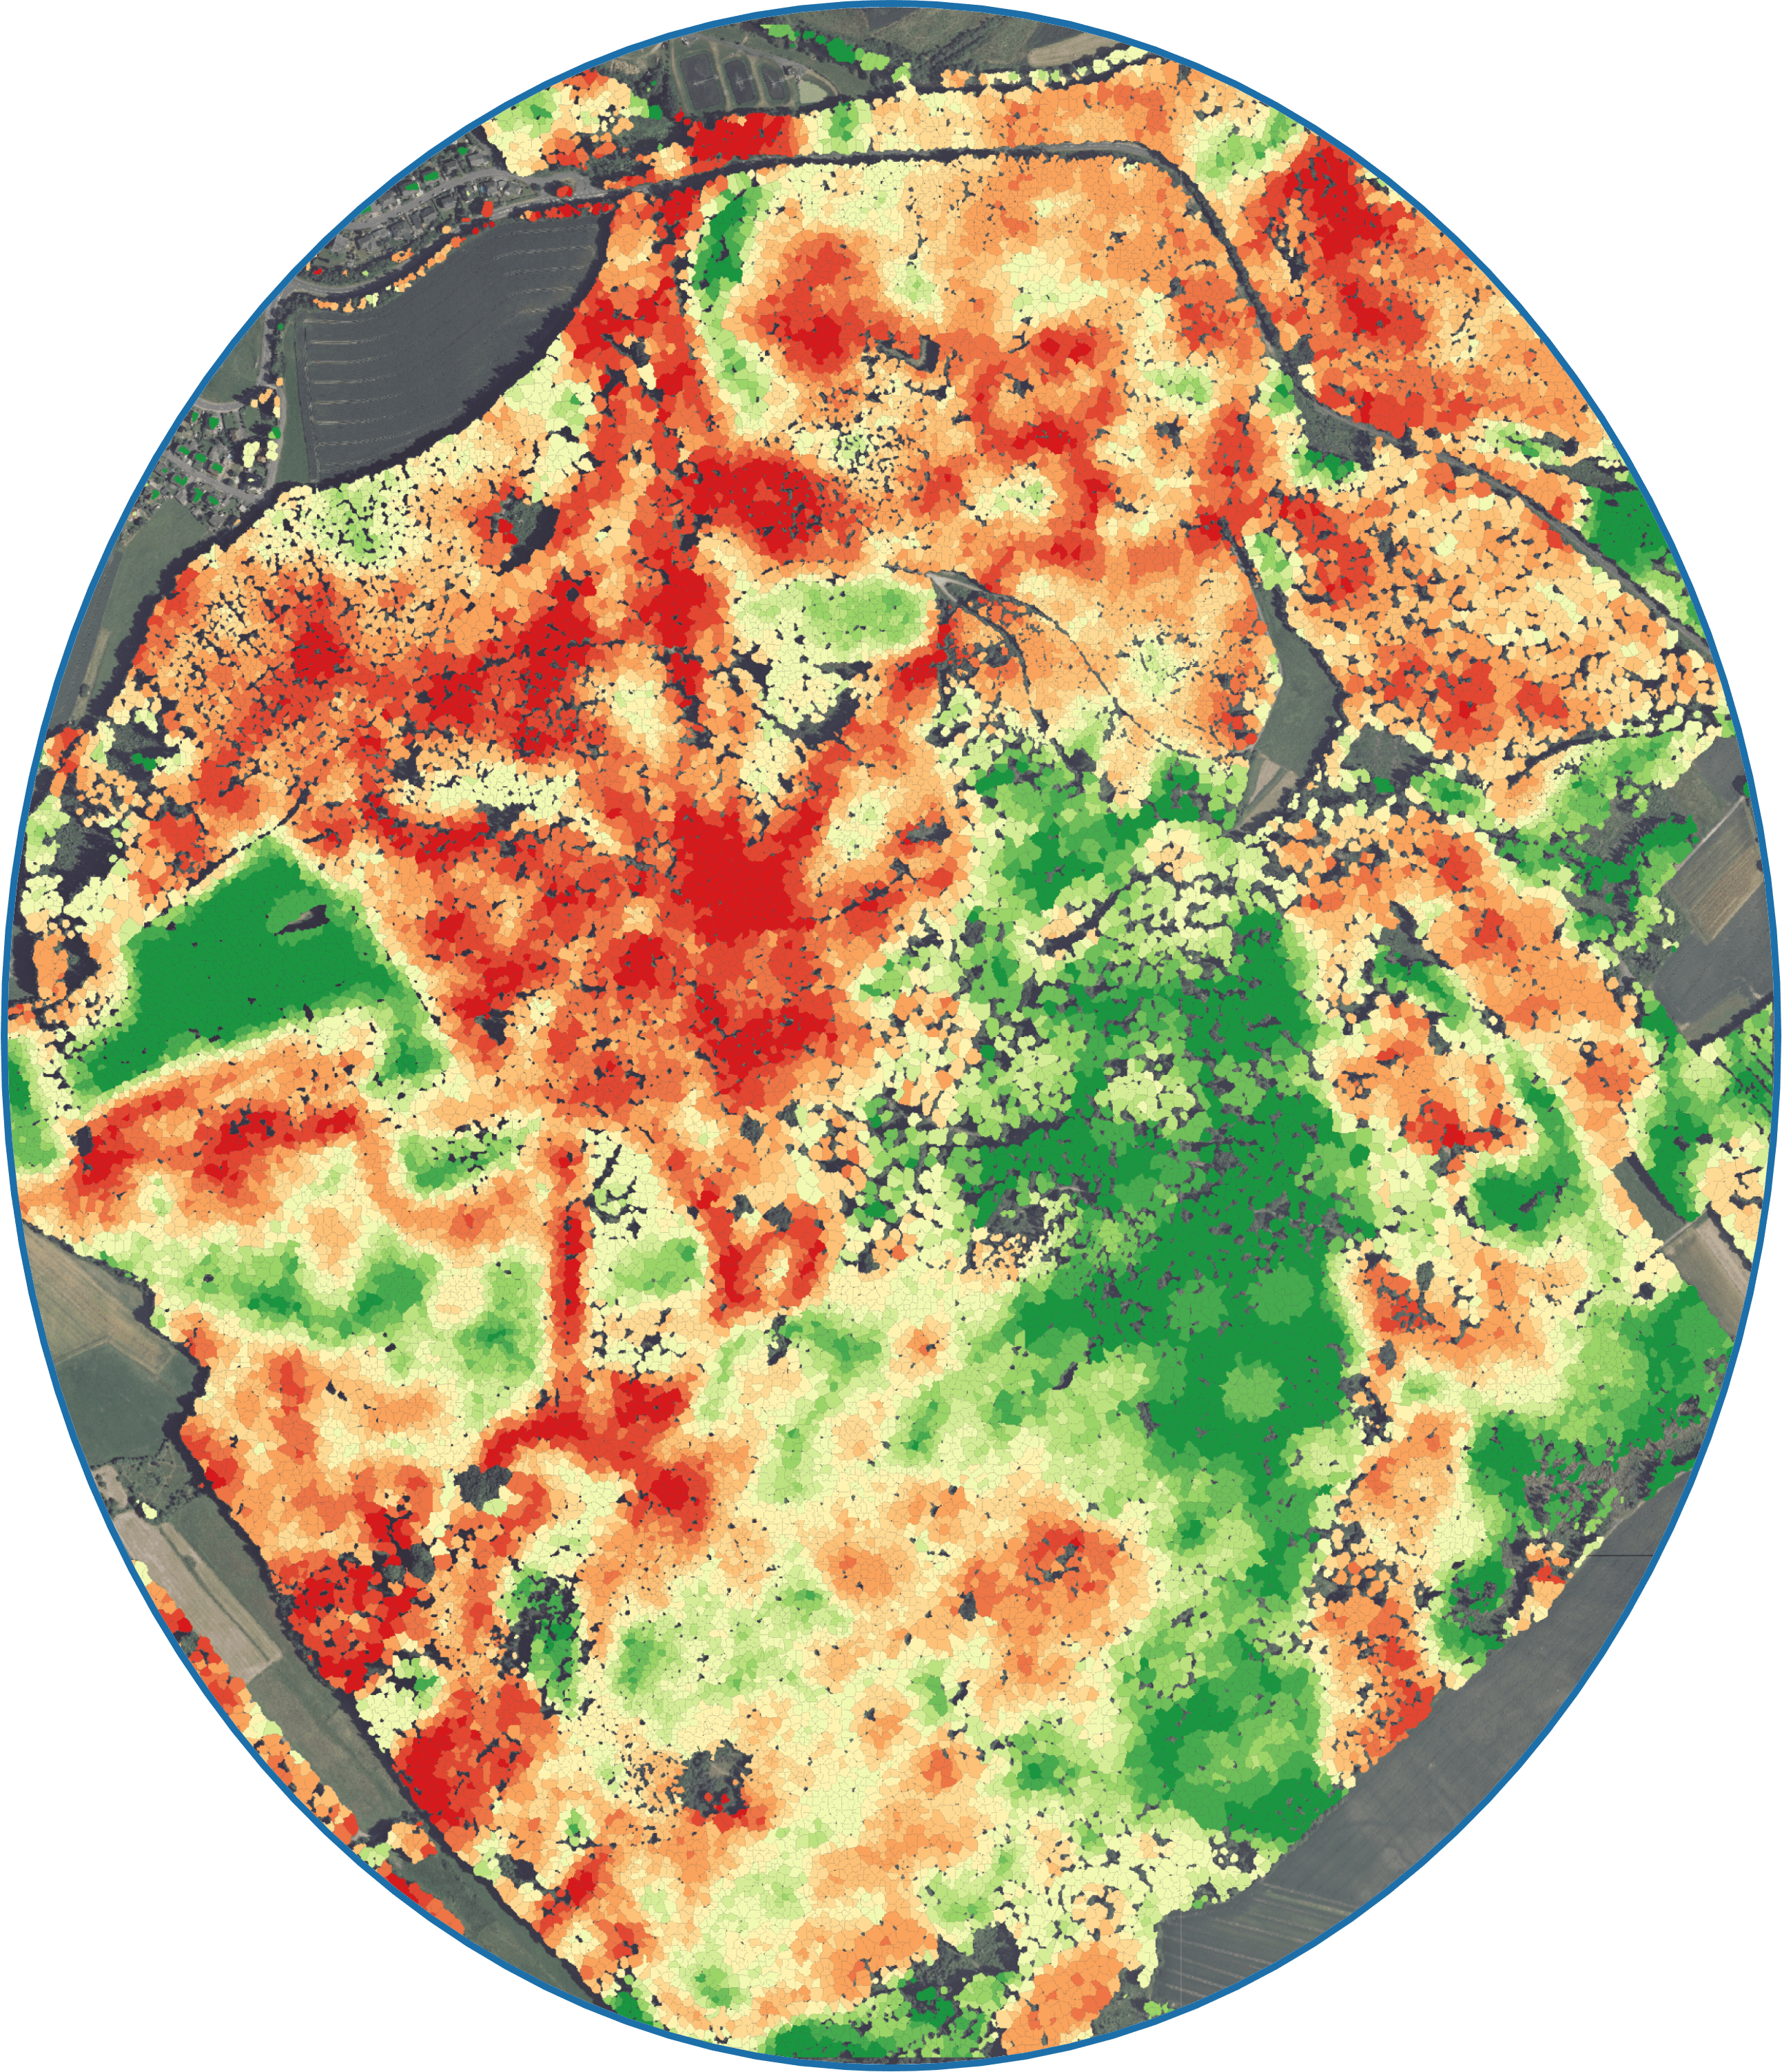
Tree species biodiversity map.
What is it about?
Forests represent the most diverse habitat for different species around the globe. Their monitoring is one of the most crucial tasks for biodiversity management. Traditional means of monitoring forests are cost and labor-intensive, which leads to low revisit frequencies and small monitored areas. Additionally, the results of data acquisitions by human agents make the results hardly reproducible. To overcome these limitations, a LOEWE research project called Natur4.0 has been initiated between several German research institutes. In this project, I participated in a student’s seminar and analyzed tree species and forest structures employing remote sensing techniques.
What it can do!
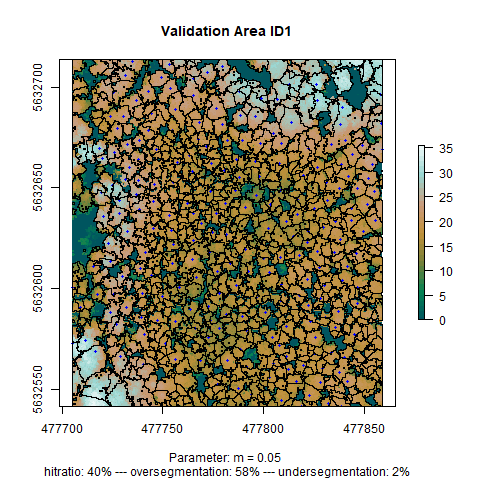
In this project, I used RGB orthoimages and a point cloud derived from Light Detection and Ranging (LiDAR) data to train a segmentation algorithm to distinguish between individual trees based on a Canopy Height Model. This technique is based on a watershed algorithm that “grows” continues segments around a tree’s central position to delineate the total tree crown.
Once we successfully generated the tree objects, we used an object-based classification of the tree species. As predictors, we used several artificially created indices and filters from RGB images. Finally, we trained a Random Forest model to predict the tree species. Using the point cloud, structural forest parameters, such as vegetation density, can be aggregated on the level of individual trees and then analyzed. We see this result in the picture above where I calculated the Shannon-Index based on the number of different tree species found in a circular 10 meters environment. Green colors show lower numbers of tree species, while red colors indicate a relative species richness.
You can check out the results on a comprehensive website! You are also invited to read through the code for the analysis.